<?xml version="1.0" encoding="utf-8"?><feed xmlns="http://www.w3.org/2005/Atom" ><generator uri="https://jekyllrb.com/" version="3.10.0">Jekyll</generator><link href="https://wolfvswhale.github.io/feed.xml" rel="self" type="application/atom+xml" /><link href="https://wolfvswhale.github.io/" rel="alternate" type="text/html" /><updated>2026-08-06T01:22:35+00:00</updated><id>https://wolfvswhale.github.io/feed.xml</id><title type="html">J. Alderman Lyell</title><subtitle>Notes on evaluating machine-written prose. Mostly measurements, including the ones that went against me.</subtitle><author><name>J. Alderman Lyell</name></author><entry><title type="html">What GDPval’s rubrics actually measure</title><link href="https://wolfvswhale.github.io/2026/08/06/gdpval-rubrics.html" rel="alternate" type="text/html" title="What GDPval’s rubrics actually measure" /><published>2026-08-06T00:00:00+00:00</published><updated>2026-08-06T00:00:00+00:00</updated><id>https://wolfvswhale.github.io/2026/08/06/gdpval-rubrics</id><content type="html" xml:base="https://wolfvswhale.github.io/2026/08/06/gdpval-rubrics.html"><![CDATA[<p>GDPval asks whether models can do economically valuable knowledge work. It contains 220 tasks drawn from 44 occupations, each with a prompt, supporting files, a reference deliverable produced by a working professional, and a grading rubric. It is one of the most cited benchmarks in the field, it appears in frontier model release announcements, and its dataset has been downloaded more than 120,000 times.</p>

<p>Epoch AI reviewed it in February 2026, alongside RLI and APEX-Agents, and made a structural argument: the tasks are performed in isolation from any broader business context, so a high score indicates task-level assistance rather than job automation. That is an argument about what the tasks are.</p>

<p>This is an argument about how they are graded. GDPval’s score is the output of 10,453 written rubric criteria, and nobody has opened them. I did, and the finding is not that the rubrics are bad. Most of them are careful, and some are better than what I have seen inside professional audit shops. The finding is that they are wildly uneven, in specific ways that make GDPval’s aggregate number less comparable across tasks than it looks.</p>

<h2 id="main-takeaways">Main takeaways</h2>

<ul>
  <li>The maximum attainable score varies from <strong>22 to 234 points</strong> across the 220 tasks, a 10.6-fold spread, with 95 distinct values. Nothing in the published dataset normalizes this.</li>
  <li>One rubric line, <strong>“Overall formatting and style of the deliverable”</strong>, appears in <strong>138 of 220 tasks</strong>, always worth exactly 5 points. It is not a claim about the submission that a grader can mark true or false. It carries between 2.8% and 21.7% of a task’s available score depending on which task you land on.</li>
  <li><strong>Four tasks can score arbitrarily negative.</strong> The worst is a real estate comparative market analysis with a ceiling of +50 and penalty criteria totalling -380.</li>
  <li><strong>95 of 220 tasks (43%) ship with no reference files at all</strong>, and 35 with no reference deliverable. Sixteen have neither.</li>
  <li>Three fields in the published rubric schema, <code class="language-plaintext highlighter-rouge">required</code>, <code class="language-plaintext highlighter-rouge">read_only</code>, and <code class="language-plaintext highlighter-rouge">form_content</code>, are null on all 10,453 criteria.</li>
  <li>Several things I expected to find wrong are not. Occupation coverage is exact, every criterion is human-authored, duplicate criteria are rare, and no task’s prompt refers to an input file that is missing.</li>
</ul>

<p>Everything above is exact and recomputable from the published parquet. The code is at the end.</p>

<h2 id="anatomy-of-a-task-and-of-a-good-rubric">Anatomy of a task, and of a good rubric</h2>

<p>The first task in the dataset is an audit engagement. The model is given a spreadsheet of 1,516 anti-financial-crime risk metrics and asked to select and document a statistical sample. Its rubric runs to 26 criteria.</p>

<p>That rubric is excellent, and it is worth being concrete about why, because it sets the standard the rest of the benchmark should be measured against. It names the sampling parameters: z = 1.645, p = 0.5, e = 0.10, with finite population correction. Those four numbers plus the population size fully determine the answer. I ran it: n₀ = 67.65, and after correction against N = 1,516 the required sample size is 65. There is exactly one right number and the rubric contains enough to derive it.</p>

<p>It goes further. Six criteria are conditional, of the form “if Cayman Islands occurs in the Country column, at least one such row is flagged as sampled.” I checked all six against the actual spreadsheet. Marine Finance occurs 228 times, Correspondent Banking 28, Cayman Islands 21, Pakistan 34, UAE 59, and 401 rows have both quarters at zero. Five of the six guards fire on real data. The sixth names “UAE or United Arab Emirates” and only the abbreviation appears, which is not an error because the criterion accepts either.</p>

<p>This is a rubric written by somebody who did the work, opened the file, and checked their own conditions. Two careful graders reading the same submission against it will produce the same score.</p>

<p>Now the other end.</p>

<h2 id="1-points-do-not-mean-the-same-thing-on-different-tasks">1. Points do not mean the same thing on different tasks</h2>

<p>Criteria per task range from 14 to 137. Maximum attainable score ranges from 22 to 234, with a median of 72 and 95 distinct values across 220 tasks.</p>

<p>If GDPval scores are aggregated as raw points, a model that does well on the 234-point task is rewarded more than ten times as much as one that does equally well on the 22-point task, and the ranking becomes partly a fact about which tasks a model happens to suit. If they are normalized per task, then the granularity of the score varies by an order of magnitude: on a 14-criterion task the smallest possible increment is roughly 7% of the total, and on a 137-criterion task it is under 1%.</p>

<p>I want to be precise about what I can and cannot say here. The published dataset contains the rubrics; it does not contain the grading harness. Whether OpenAI normalizes per task before aggregating is not visible in what has been released, and I am not asserting they do not. What I am asserting is that the rubric layer as published carries no normalization, so anyone building on GDPval, and there are several such projects now, has to make that choice themselves, and the choice moves the number.</p>

<h2 id="2-one-line-138-tasks-and-no-way-to-grade-it">2. One line, 138 tasks, and no way to grade it</h2>

<p>The single most reused rubric criterion in GDPval is this:</p>

<blockquote>
  <p>Overall formatting and style of the deliverable</p>
</blockquote>

<p>It appears 138 times, in 138 distinct tasks, which is 62.7% of the benchmark. It is always worth 5 points. It accounts for 690 points, 4.1% of every positive point in GDPval.</p>

<p>A rubric criterion has to be a proposition. It has to be a claim about the submission that is either true or false, so that two graders reading the same document reach the same verdict. “The workbook contains a worksheet named exactly ‘Sample Size Calculation’” is a proposition. “Overall formatting and style of the deliverable” is a topic with a price tag. There is nothing to mark.</p>

<p>Its weight is not constant either, because it is a flat 5 points against ceilings that vary tenfold. On the highest-ceiling task it is 2.8% of the score. On the lowest it is 21.7%. So the amount of any given task’s score that rests on an ungradeable line is itself an artifact of how long that task’s rubric happens to be.</p>

<p>There is a charitable reading, which is that this line is a hook for a human grader’s holistic impression and everyone involved knows it. I think that reading is probably right. It still means that on nearly two thirds of GDPval, a fixed slice of the score is grader impression rather than measurement, and that slice is larger on exactly the tasks where the rubric is thinnest.</p>

<h2 id="3-four-tasks-have-no-floor">3. Four tasks have no floor</h2>

<p>Eighteen tasks (8.2%) contain penalty criteria, 94 in total. In most of them the penalties are modest and clearly intended to punish specific failures.</p>

<p>In four tasks, the penalties exceed the maximum attainable score. The extreme case is a Real Estate Brokers task asking for a comparative market analysis. Its rubric has 10 positive criteria worth 50 points and 38 penalty criteria worth -380. The penalties are structured per data category and per comparable property: “Includes an empty address for any sold comp”, “Fails to identify the lot size for any sold comp”, “Fails to identify the year built for any sold comp”, each at -10.</p>

<p>These are not independent failures. A submission that produces the comps table but leaves it sparsely populated trips a dozen of them at once. A submission that omits the table entirely trips all 38. The floor is -380 against a ceiling of +50, and the distance between a mediocre answer and an empty one is more than seven times the distance between an empty answer and a perfect one.</p>

<p>What that does to an aggregate depends entirely on how the harness clamps, and again, the harness is not published. If negative task scores propagate into a mean, a single model failure on this one task moves the benchmark average more than success on any five other tasks.</p>

<h2 id="4-forty-three-percent-of-tasks-come-with-nothing-attached">4. Forty-three percent of tasks come with nothing attached</h2>

<p>95 of the 220 tasks have zero reference files. 35 have no reference deliverable, meaning no professional-produced answer to compare against. Sixteen have neither.</p>

<p>This sharpens Epoch’s February point rather than contradicting it. Their argument was that GDPval tasks sit outside a business context. The stronger version is that on 43% of them there is no context at all: the model is given a prompt and asked to invent the underlying material. For an occupation like Accountants and Auditors, the difference between “here is the population file, sample it” and “write a sampling memo” is the difference between doing the work and describing it.</p>

<p>The tasks that do carry material carry a lot of it, up to 17 files. The distribution is bimodal, and the benchmark’s name suggests the loaded end is the part that matters.</p>

<h2 id="5-small-things">5. Small things</h2>

<p>Three fields in the rubric schema, <code class="language-plaintext highlighter-rouge">required</code>, <code class="language-plaintext highlighter-rouge">read_only</code> and <code class="language-plaintext highlighter-rouge">form_content</code>, are null on all 10,453 items. They are presumably live in OpenAI’s internal grading tool and were stripped or never populated on release. A consumer of the public dataset cannot tell whether a criterion was mandatory.</p>

<p>Duplicate criteria within a single task occur 8 times across 7 tasks, which is 0.08% of criteria. That is a clean result and I report it because I went looking for it expecting worse.</p>

<p>Every one of the 10,453 criteria is marked <code class="language-plaintext highlighter-rouge">author_type: human</code>. There is no model-written rubric content in the public release.</p>

<h2 id="what-this-does-and-does-not-mean">What this does and does not mean</h2>

<p>It does not mean GDPval is broken, and it does not mean the reported numbers are wrong. Most of these rubrics are careful, the occupational coverage is exactly balanced at five tasks for each of 44 occupations, and the best of them are more rigorous than the working standards of the professions they model.</p>

<p>It means the instrument is not uniform, and the non-uniformity is invisible in a headline win rate. A GDPval score is an average over 220 tasks whose scoring scales differ by a factor of ten, where 63% of tasks reserve a fixed slice for grader impression, where four tasks have unbounded downside, and where 43% supply no input material. Those are not reasons to discard the benchmark. They are reasons a two-point difference between two models is not obviously a difference in capability, and reasons that anyone comparing GDPval scores across papers should check that both used the same aggregation.</p>

<p>The cheapest fixes are also the most obvious. Normalize per task, or publish the normalization. Replace the recurring formatting line with the two or three testable properties it stands in for, or drop its points. Clamp task scores at zero, or state that they are not clamped. None of that requires rewriting a single task.</p>

<h2 id="method-and-limitations">Method and limitations</h2>

<p>Every figure in this review is computed from <code class="language-plaintext highlighter-rouge">openai/gdpval</code> on Hugging Face, revision <code class="language-plaintext highlighter-rouge">main</code>, retrieved 5 August 2026. The analysis is in <code class="language-plaintext highlighter-rouge">audit/structure.py</code> and takes about two seconds. <code class="language-plaintext highlighter-rouge">results/structure.json</code> holds the output.</p>

<p>The sampling verification in the second section downloads one reference workbook and recomputes the required sample size from the parameters stated in the rubric. That is the only claim here that touches file contents.</p>

<p>Three limitations matter.</p>

<p>The grading harness is not public, so I cannot see aggregation, clamping, or normalization. Every claim about what these rubric properties do to a final score is conditional on that, and I have tried to mark it each time.</p>

<p>I built a classifier to estimate what share of criteria are subjective rather than checkable, and it did not survive validation. Reading its output, it labelled plainly gradeable lines like “The Margin Impact pie chart contains exactly two slices labeled Cost and Investment” as unanchored merely because they contain no quoted string or numeral, and flagged “The report contains a clearly labeled Results section” as subjective on the strength of the word “clearly”. Its numbers are not in this review. The code is in <code class="language-plaintext highlighter-rouge">audit/verifiability.py</code> with the failure documented, because a negative methodological result is still a result, and because the honest version of the subjectivity question needs hand-labelling that I have not done.</p>

<p>Finally, I have audited the rubrics, not the tasks. Whether GDPval’s 220 prompts are representative of the 44 occupations, and whether the reference deliverables are actually good, are separate questions requiring occupational expertise I have only for a couple of these fields.</p>

<hr />

<p>Code, data and results: <a href="https://github.com/wolfvswhale/gdpval-audit">github.com/wolfvswhale/gdpval-audit</a>
Prior work: <a href="https://epoch.ai/blog/what-do-economic-value-benchmarks-tell-us">Epoch AI, “What do ‘economic value’ benchmarks tell us?”</a>, February 2026</p>]]></content><author><name>J. Alderman Lyell</name></author><summary type="html"><![CDATA[10,453 rubric criteria across 220 tasks. Score scales vary tenfold, one untestable line appears in 138 tasks, and four tasks have no scoring floor.]]></summary></entry><entry><title type="html">The detection field built its replacements and never switched</title><link href="https://wolfvswhale.github.io/2026/08/05/detection-field-built-its-replacements.html" rel="alternate" type="text/html" title="The detection field built its replacements and never switched" /><published>2026-08-05T00:00:00+00:00</published><updated>2026-08-05T00:00:00+00:00</updated><id>https://wolfvswhale.github.io/2026/08/05/detection-field-built-its-replacements</id><content type="html" xml:base="https://wolfvswhale.github.io/2026/08/05/detection-field-built-its-replacements.html"><![CDATA[<p>I spent this week building an evaluation harness for a prose rubric, and the corpus made a liar out of it.</p>

<p>The rubric flags constructions that mark machine-written text. Eighteen gates, thresholds calibrated against 2,602 human documents so the false-positive rate is a measured 5% rather than a guess. Then I validated it against HC3, the standard paired human/machine corpus, and nine of the eighteen gates fired <em>more often on human writing than on machine writing</em>. The two constructions any reader in 2026 notices first, the em dash and <code class="language-plaintext highlighter-rouge">not just X, it's Y</code>, scored 0.0x and 0.3x. By the corpus, my best rules were my worst.</p>

<p>The rules aren’t wrong. HC3 was collected between December 2022 and January 2023, from the ChatGPT web interface. The paper never states a collection date; you infer it from the launch on 30 November 2022 and the arXiv posting on 18 January 2023. Those models did not write the way current models write, so the corpus cannot contain the behaviour I was testing for.</p>

<p>That is a boring conclusion about one dataset. The interesting version is what happens when you check whether the rest of the field has the same problem.</p>

<h2 id="what-the-field-actually-reports-numbers-on">What the field actually reports numbers on</h2>

<p>RAID is the standard. Ten million documents, eleven genres, twelve adversarial attacks, ACL 2024, and a live leaderboard at raid-bench.xyz. Its generations were produced in a fifteen-day window, 1 to 15 November 2023, against eleven models topping out at <code class="language-plaintext highlighter-rouge">gpt-4-0613</code>. That window is stated plainly in Appendix E.6 of the paper, which is more than most benchmarks tell you. There has been no v2. The COLING 2025 shared task re-used the November 2023 generations.</p>

<p>M4 generated in 2023. M4GT-Bench added LLaMA-2 and Jais in early 2024. SemEval-2024 Task 8 ran on the same lineage, and the COLING 2025 successor re-used those generations too. DetectRL’s four generators are <code class="language-plaintext highlighter-rouge">gpt-3.5-turbo</code>, <code class="language-plaintext highlighter-rouge">chat-bison@002</code>, <code class="language-plaintext highlighter-rouge">claude-instant-1.2</code>, and Llama-2-70b-chat, which pins collection to roughly late 2023.</p>

<p>So the corpora the field reports numbers on were built between late 2022 and early 2024, against models whose ceiling is GPT-4 and Claude Instant.</p>

<h2 id="the-replacements-exist">The replacements exist</h2>

<p>Here is where my first draft was wrong, and where I’d have been caught inside five minutes.</p>

<p>Newer benchmarks are not missing. They are numerous. MIRAGE (September 2025) covers seventeen generators including o3-mini, Claude 3.7, DeepSeek-R1, and Grok-2. MAGA-Bench (January 2026) has 936,000 samples across Qwen3, DeepSeek-V3 and R1, and Gemini 2.0. TSM-Bench (May 2026) reports detection accuracy dropping 10 to 40 percent relative to prior benchmarks. DetectRL-X (May 2026) is a direct refresh of DetectRL across eight languages with GPT-4o, Gemini 2.5, DeepSeek-V3, and Qwen-Max. AITDNA (June 2026), from UKP Lab, samples GPT-5.2, Gemini 3 Flash, Llama 4 Scout, and DeepSeek V3.2, and records the full human editing history rather than treating authorship as binary. OpAI-Bench (June 2026) runs on GPT-5.4.</p>

<p>The work is done. It is public. It uses current models.</p>

<p>Now the citation counts, checked on Semantic Scholar today. HC3: 892. M4: 190. MAGE: 184. RAID: 181. M4GT: 71. DetectRL: 48.</p>

<p>MIRAGE: 7. AITDNA: 2. MAGA-Bench: 1. TSM-Bench: 1. DetectRL-X: 0.</p>

<p>Some of that is just age; a June 2026 paper has not had time to be cited. But the gap is three orders of magnitude, and the older corpora are still what new detector papers benchmark against. The field built the replacements and has not switched to them.</p>

<h2 id="the-measurement-nobody-has-made">The measurement nobody has made</h2>

<p>I went looking for the obvious study: train a detector on 2022-era output, then plot its accuracy against generator vintage, 2022 through 2026. One independent variable, one curve.</p>

<p>It does not exist.</p>

<p>There is a great deal of adjacent work, and it is good work. “Rethinking AI-Generated Text Detection” (July 2026) shows a plain fine-tuned RoBERTa matches specialised detectors in-distribution and degrades sharply when the topic or the generating model changes, and that more training data does not close the gap. “Hitting a Moving Target” (June 2026) names three post-deployment shifts explicitly, including new LLM releases, and reports that commercial Pangram catches 24.1 percent of their adversarial humanised text against 90.5 percent for a test-time-adaptation approach. “Base Models Look Human To AI Detectors” (May 2026) finds GPTZero and Pangram rate base-model output as overwhelmingly human while flagging the instruction-tuned versions of the same models, and concludes that detectors are tracking artifacts of instruction tuning rather than any invariant property of machine text. “Spotlights and Blindspots” (April 2026) runs fifteen detectors and finds the rank order flips depending on which dataset and metric you pick.</p>

<p>Every one of those frames the problem as cross-generator generalisation or distribution shift. None isolates release date. The difference matters, because “detector fails on an unseen model” and “detector fails on models released after its training corpus” are different claims with different remedies. The first is solved by broader coverage. The second is only solved by refresh cadence, and no widely-used benchmark has one.</p>

<h2 id="what-a-rule-looks-like-when-the-corpus-can-see-it">What a rule looks like when the corpus can see it</h2>

<p>The em dash is the one construction where somebody has done the work properly.</p>

<p>A pre-registered study posted in June 2026 measured em-dash prevalence in the Discussion sections of 69,632 first-version medRxiv preprints from 2020 to 2025. Prevalence rose from 4.23 percent before 30 November 2022 to 11.58 percent after, an absolute increase of 7.35 points with a confidence interval of 6.94 to 7.77. It was not a jump at launch. It was roughly 4 percent through 2023, 8.0 percent in 2024, and 20.3 percent in 2025. A placebo split inside the pre-LLM era moved the number by 0.13 points, which is nothing. The analysis plan was frozen on OSF before any confirmatory result.</p>

<p>The authors are careful, and their caveat belongs here: the em dash is a population-level indicator, not a per-paper detector, and the design cannot establish causality.</p>

<p>Read that timeline against HC3’s collection window. The em-dash rise was still four years from its 2025 peak when HC3 was collected. My gate scoring 0.0x on that corpus is not evidence about the rule. It is a date stamp.</p>

<p>There is a second finding that cuts the other way and deserves equal billing. “The Last Fingerprint” (March 2026) tested twelve models across five providers under a markdown-suppression experiment and found em-dash rates ranging from 0.0 per thousand words, literally zero, for Meta’s Llama models, to 9.1 for GPT-4.1. The paper argues the em dash is markdown leaking into prose, which makes it a fingerprint of a fine-tuning procedure rather than a property of machine writing in general. A rule that catches OpenAI models and misses Meta’s is not a detector. It is a vendor classifier.</p>

<p>For <code class="language-plaintext highlighter-rouge">not just X, it's Y</code>, the construction I would have bet on hardest, there is no quantitative study at all. I searched arXiv for negative parallelism, antithesis, and contrastive-construction framings and found nothing. The only figures in circulation come from journalism I could not open directly, so I am not repeating them. The most recognisable tic in current model prose has never been measured, and that is its own small indictment.</p>

<h2 id="what-i-think-follows">What I think follows</h2>

<p>Three things, in the order I’d act on them.</p>

<p>Cite the benchmark’s generation date, not its publication date. RAID states its window in an appendix. Most do not, and the gap between generation and publication is routinely a year.</p>

<p>Report per-generator results and treat the newest model in the corpus as the ceiling of what your number describes. A detector at 0.95 AUROC on RAID has demonstrated something about <code class="language-plaintext highlighter-rouge">gpt-4-0613</code>. That may still be useful. It is not a claim about 2026.</p>

<p>Somebody should run the vintage study. Fixed detector, fixed human corpus, machine text stratified by model release date, accuracy plotted against vintage. It is a week of API calls and a plot. Its absence is the reason nobody can say whether detection is getting harder or just differently hard.</p>

<p>I am building the corpus for it, which means I have an interest in the answer and you should discount accordingly. The licensing constraints are the hard part, not the generation, and I’ll write that up separately.</p>

<hr />

<p><strong>Sources.</strong> RAID: <a href="https://arxiv.org/abs/2405.07940">arXiv:2405.07940</a>, leaderboard <a href="https://raid-bench.xyz/">raid-bench.xyz</a>. HC3: <a href="https://arxiv.org/abs/2301.07597">arXiv:2301.07597</a>. M4: <a href="https://arxiv.org/abs/2305.14902">arXiv:2305.14902</a>. M4GT-Bench: <a href="https://arxiv.org/abs/2402.11175">arXiv:2402.11175</a>. SemEval-2024 Task 8: <a href="https://arxiv.org/abs/2404.14183">arXiv:2404.14183</a>. DetectRL: <a href="https://arxiv.org/abs/2410.23746">arXiv:2410.23746</a>. MIRAGE: <a href="https://arxiv.org/abs/2509.14268">arXiv:2509.14268</a>. MAGA-Bench: <a href="https://arxiv.org/abs/2601.04633">arXiv:2601.04633</a>. TSM-Bench: <a href="https://arxiv.org/abs/2605.31113">arXiv:2605.31113</a>. DetectRL-X: <a href="https://arxiv.org/abs/2605.15518">arXiv:2605.15518</a>. AITDNA: <a href="https://arxiv.org/abs/2606.04906">arXiv:2606.04906</a>. OpAI-Bench: <a href="https://arxiv.org/abs/2606.06481">arXiv:2606.06481</a>. Distribution shift: <a href="https://arxiv.org/abs/2607.03680">arXiv:2607.03680</a>. Moving target: <a href="https://arxiv.org/abs/2606.25152">arXiv:2606.25152</a>. Base models: <a href="https://arxiv.org/abs/2605.19516">arXiv:2605.19516</a>. Spotlights and blindspots: <a href="https://arxiv.org/abs/2604.16607">arXiv:2604.16607</a>. Em-dash study: <a href="https://arxiv.org/abs/2606.29540">arXiv:2606.29540</a>, pre-registration OSF HFT8C. Markdown fingerprint: <a href="https://arxiv.org/abs/2603.27006">arXiv:2603.27006</a>. Citation counts from Semantic Scholar, 5 August 2026.</p>

<p>The harness and the rubric are at <a href="https://github.com/wolfvswhale/prose-eval">prose-eval</a> and <a href="https://github.com/wolfvswhale/bluepencil">bluepencil</a>, including the results that made both look bad.</p>]]></content><author><name>J. Alderman Lyell</name></author><summary type="html"><![CDATA[The benchmarks the field reports numbers on were built 2022-2024. Newer ones exist and carry single-digit citation counts.]]></summary></entry><entry><title type="html">I ran the vintage study. Release date does not predict detectability.</title><link href="https://wolfvswhale.github.io/2026/08/05/vintage-study.html" rel="alternate" type="text/html" title="I ran the vintage study. Release date does not predict detectability." /><published>2026-08-05T00:00:00+00:00</published><updated>2026-08-05T00:00:00+00:00</updated><id>https://wolfvswhale.github.io/2026/08/05/vintage-study</id><content type="html" xml:base="https://wolfvswhale.github.io/2026/08/05/vintage-study.html"><![CDATA[<p>In the last review I complained that nobody had measured the obvious thing: take a detector, plot its accuracy against the release date of the model that produced the text, and see whether the curve falls. I said it was a week of API calls and a plot.</p>

<p>I was wrong about the API calls. The data already exists. RAID labels every generation with the model that made it, spanning GPT-2 through <code class="language-plaintext highlighter-rouge">gpt-4-0613</code>. MAGA-Bench extends the range to May 2025. Attach a public release date to each generator, cut the results that way, and the curve draws itself.</p>

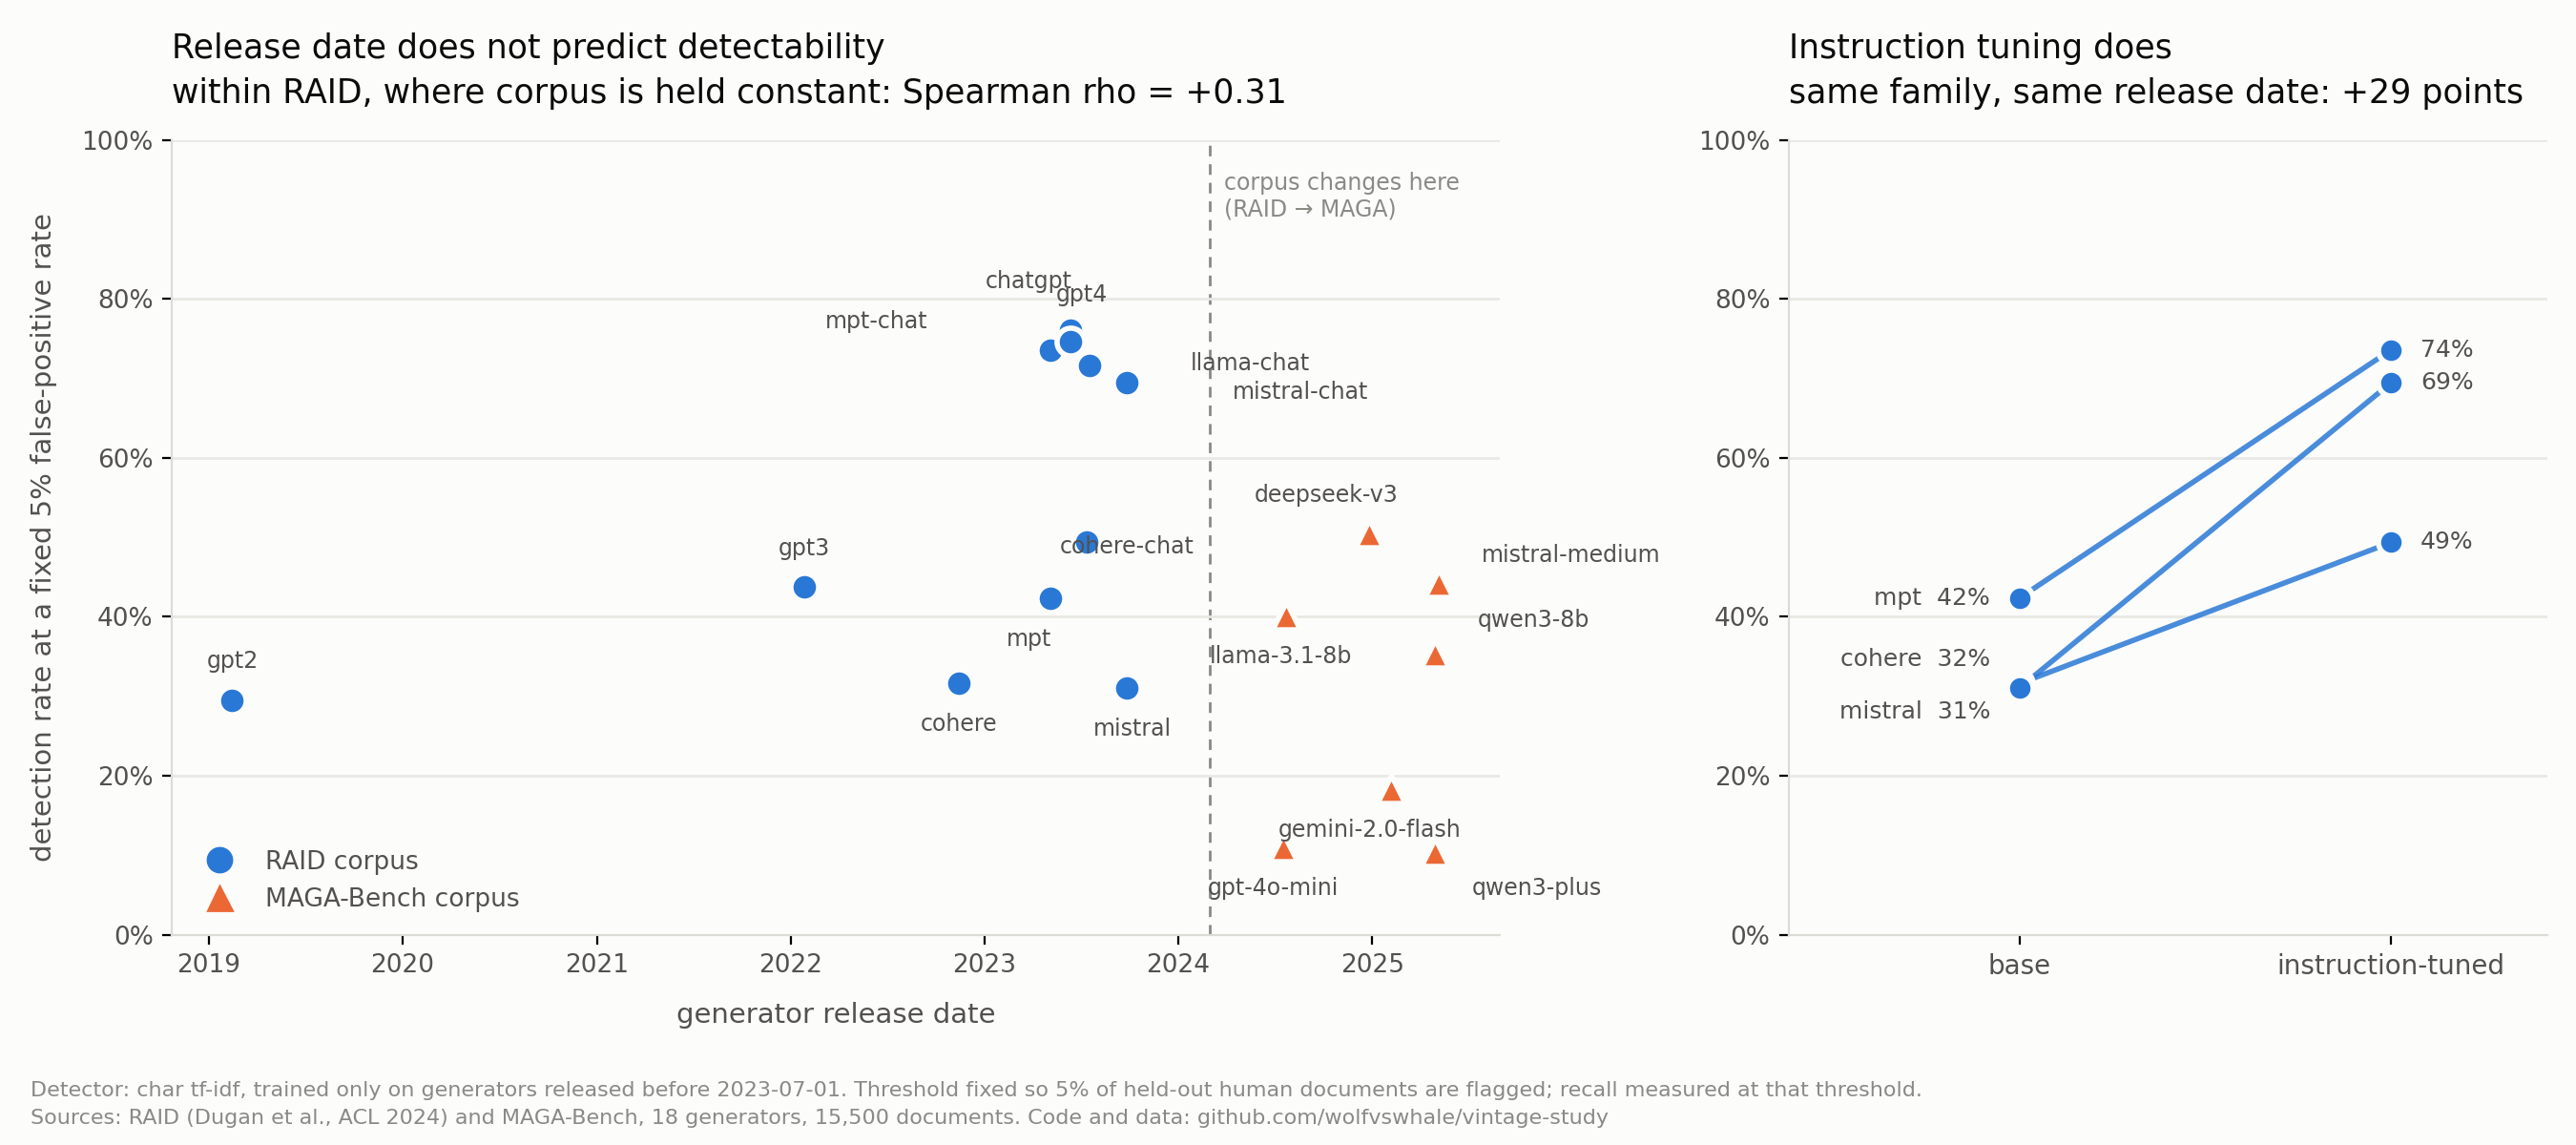
<p>Here it is, across 18 generators and 15,500 documents.</p>

<p><img src="/assets/vintage.png" alt="Detection rate against generator release date, and the base-versus-chat comparison" /></p>

<p>The left panel is the study I asked for. The right panel is what actually explains the numbers.</p>

<h2 id="the-method-briefly">The method, briefly</h2>

<p>Train on generators released before July 2023, which simulates someone building a detector when those were the newest models available. Then fix the score threshold so exactly 5% of held-out human documents are flagged, and measure per-generator recall at that fixed false-positive rate.</p>

<p>Fixing the threshold on the human class matters. Report raw accuracy instead and a detector can look better on a generator merely by becoming more trigger-happy. Human documents have no vintage, so the same held-out human pool serves every generator and any movement in the curve has to come from the machine side.</p>

<p>Three detectors, chosen to have different inductive biases: character n-gram TF-IDF, word n-gram TF-IDF, and a 38-feature interpretable model built from sentence-length variance, paragraph shape, punctuation rates, and lexical diversity. If an effect is real it should show up in all three.</p>

<h2 id="release-date-does-not-predict-detectability">Release date does not predict detectability</h2>

<p>Within RAID, where corpus and genre are held constant, the rank correlation between release date and detection rate is <strong>positive</strong>: +0.31, +0.34, +0.42.</p>

<p>Newer generators are more detectable, not less. GPT-2 from 2019 sits at 29.5%. GPT-4 from June 2023 sits at 74.7%. That is the opposite of the assumption the whole field operates on.</p>

<p>Pool RAID with MAGA-Bench and the correlation flips to −0.26 and −0.55 for the two n-gram detectors. That looks like the decay everyone expects, and it is an artifact: every post-2024 generator in this study lives in MAGA, so the pooled correlation is measuring the corpus boundary, not the passage of time. The dashed line in the figure is where the corpus changes. Most of the apparent slope is that line.</p>

<h2 id="instruction-tuning-does">Instruction tuning does</h2>

<p>RAID contains three families where a base model and its instruction-tuned sibling shipped on the same day. That holds release date, family, corpus, and detector constant and varies only the tuning.</p>

<table>
  <thead>
    <tr>
      <th>family</th>
      <th>base</th>
      <th>instruction-tuned</th>
      <th>difference</th>
    </tr>
  </thead>
  <tbody>
    <tr>
      <td>MPT</td>
      <td>42.4%</td>
      <td>73.6%</td>
      <td>+31.3</td>
    </tr>
    <tr>
      <td>Cohere</td>
      <td>31.6%</td>
      <td>49.4%</td>
      <td>+17.8</td>
    </tr>
    <tr>
      <td>Mistral</td>
      <td>31.0%</td>
      <td>69.5%</td>
      <td>+38.4</td>
    </tr>
  </tbody>
</table>

<p>Three for three, in the same direction, averaging 26 to 29 points across the n-gram detectors. Nothing in the date column moves recall that far.</p>

<p>This is not a new idea, and I want to be clear that I did not get there first. “Base Models Look Human To AI Detectors” reached the same conclusion in May 2026 from Llama-3 and Qwen-3 with a different method, and concluded that detectors track artifacts of instruction tuning rather than any invariant property of machine text. What this adds is an independent replication on older, different models, arriving from a study that was designed to look for something else.</p>

<p>The practical reading: when a detector is described as failing on a newer model, check whether it is failing on a <em>less instruction-tuned</em> one. Those are different problems.</p>

<h2 id="the-result-i-did-not-expect">The result I did not expect</h2>

<p>The three detectors disagree, and the disagreement is the most useful thing here.</p>

<table>
  <thead>
    <tr>
      <th>detector</th>
      <th>RAID mean</th>
      <th>MAGA mean</th>
      <th>gap</th>
    </tr>
  </thead>
  <tbody>
    <tr>
      <td>char TF-IDF</td>
      <td>55.4%</td>
      <td>30.0%</td>
      <td>−25.4</td>
    </tr>
    <tr>
      <td>word TF-IDF</td>
      <td>51.6%</td>
      <td>18.9%</td>
      <td>−32.7</td>
    </tr>
    <tr>
      <td>style features</td>
      <td>50.2%</td>
      <td>53.3%</td>
      <td><strong>+3.0</strong></td>
    </tr>
  </tbody>
</table>

<p>Both n-gram detectors lose roughly half their recall when the corpus changes. The interpretable style-feature detector does not move.</p>

<p>The same split shows up in the instruction-tuning comparison: +29 and +26 points for the n-gram detectors against +7.6 for the style features. Surface features are reading tuning artifacts and corpus idiosyncrasies. Structural features are reading something more stable.</p>

<p>If that generalises, a good deal of what the literature calls detector degradation is surface-feature brittleness rather than a property of newer models, and the fix is different from the one people are pursuing. More training data across more generators will not repair an n-gram model that is keying on the wrong thing.</p>

<p>I would not lean hard on this yet. It is three detectors, all linear, all trained on one corpus, and the style-feature model is my own so I have every incentive to like the result. It wants replication by someone who does not.</p>

<h2 id="what-this-does-not-show">What this does not show</h2>

<p><strong>Vintage and capability are entangled and this design cannot separate them.</strong> GPT-2 is both old and small; a 2025 model is both new and better. Some of the flat curve may be two effects cancelling out. Separating them needs same-capability models from different years, which mostly do not exist.</p>

<p><strong>The MAGA comparison is confounded</strong> in exactly the way I accused the field of ignoring. Corpus, genre, and prompt construction all change at the same boundary as the date. Only the within-RAID correlation isolates date, and it rests on eleven generators.</p>

<p><strong>Release dates are contestable.</strong> They are announcement dates for the specific checkpoint each corpus names, and the mapping is in the repo so it can be argued with rather than trusted. RAID’s paper and its README disagree about whether its GPT-3 is <code class="language-plaintext highlighter-rouge">text-davinci-002</code> or <code class="language-plaintext highlighter-rouge">-003</code>; I used the paper.</p>

<p><strong>The newest generator here is May 2025.</strong> That is the newest with per-generator labels in a public paired corpus, which is the original complaint biting me. Extending the curve into 2026 requires generation rather than reuse, and that is the next thing I am building.</p>

<h2 id="what-i-would-change-about-how-this-gets-reported">What I would change about how this gets reported</h2>

<p>The question “does detection get harder over time” is badly formed and I asked it badly. Time is not a mechanism. Instruction tuning is a mechanism. Corpus construction is a mechanism. Model scale is a mechanism. Release date is a proxy that bundles all three and then hides which one moved.</p>

<p>A per-generator table with release dates, tuning status, and corpus attached costs nothing to produce and would make results like this legible at a glance. Most detection papers report a single pooled number.</p>

<p>Code, data-building script, results, and the figure are at <a href="https://github.com/wolfvswhale/vintage-study">github.com/wolfvswhale/vintage-study</a>, including the twenty-one tests and the controls that did not find anything.</p>

<hr />

<p><strong>Sources.</strong> RAID: <a href="https://arxiv.org/abs/2405.07940">arXiv:2405.07940</a>, ACL 2024, generations produced 1–15 November 2023. MAGA-Bench: <a href="https://arxiv.org/abs/2601.04633">arXiv:2601.04633</a>. Base models look human: <a href="https://arxiv.org/abs/2605.19516">arXiv:2605.19516</a>. Style features from <a href="https://github.com/wolfvswhale/prose-eval">prose-eval</a>.</p>]]></content><author><name>J. Alderman Lyell</name></author><summary type="html"><![CDATA[Eighteen generators, 2019 to 2025. Release date does not predict detection rate. Instruction tuning does.]]></summary></entry></feed>